
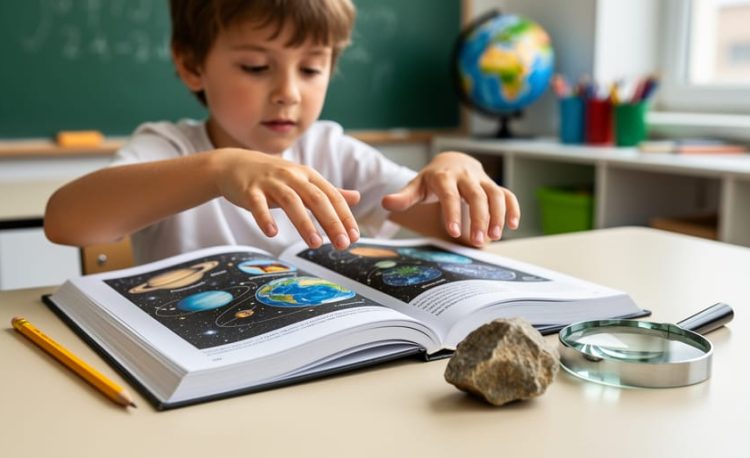
Earth and Space Science Reference Tables are collections of charts, diagrams, and data sheets that help students quickly find important information about rocks, minerals, weather patterns, planets, and Earth’s processes. Think of them as a science toolkit you can flip through whenever you need to identify a mystery rock, figure out which way the wind is blowing, or compare the sizes of different planets. These tables put tons of useful facts right at your fingertips, so you don’t have to memorize every single detail about Earth science.
Why do scientists and students use these tables? Because science is full of patterns and measurements that are easier to look up than to remember. When you’re examining a rock sample, you might need to check its hardness on the Mohs scale. When you’re tracking a weather system, you’ll want to reference cloud types and atmospheric layers. The reference tables bring all this information together in one organized place.
For young scientists like you, learning to read these tables is like gaining a secret decoder ring for the natural world. You’ll discover how to match properties with the correct minerals, use star charts to locate constellations, and understand what different weather symbols mean on maps. Ready to explore how these powerful tools can make your Earth science adventures easier and more fun?
What Are Earth and Space Science Reference Tables?

Think of reference tables as your personal fact-finding treasure maps for Earth and space! Just like a recipe book helps you find ingredients for your favorite cookies, reference tables organize scientific information so you can quickly discover what you need to know.
Reference tables are special charts packed with facts that scientists, teachers, and curious kids like you use every single day. Instead of flipping through hundreds of pages to find how big Mars is or what makes a rock hard, you can look in the reference table and find the answer in seconds. They’re like having a super smart friend who knows exactly where everything is!
These handy tools collect important information about our planet and the universe into organized sections. You might find charts showing the sizes of all the planets lined up for easy comparison. Other tables list different types of rocks with their colors, textures, and how they formed deep inside Earth or cooled from lava. Weather patterns, cloud types, and climate zones also get their own spaces in reference tables.
What makes reference tables so useful is how they group similar information together. If you’re learning about minerals, all the mineral facts are in one spot. Curious about planets? There’s a section just for space objects. This organization means you spend less time searching and more time discovering amazing facts about our world.
The best part? You don’t need to be a professional scientist to use them. With a little practice, anyone can become a reference table expert and unlock the fascinating information hiding in those charts.
What Kind of Information Do These Tables Show?
Planet and Space Facts
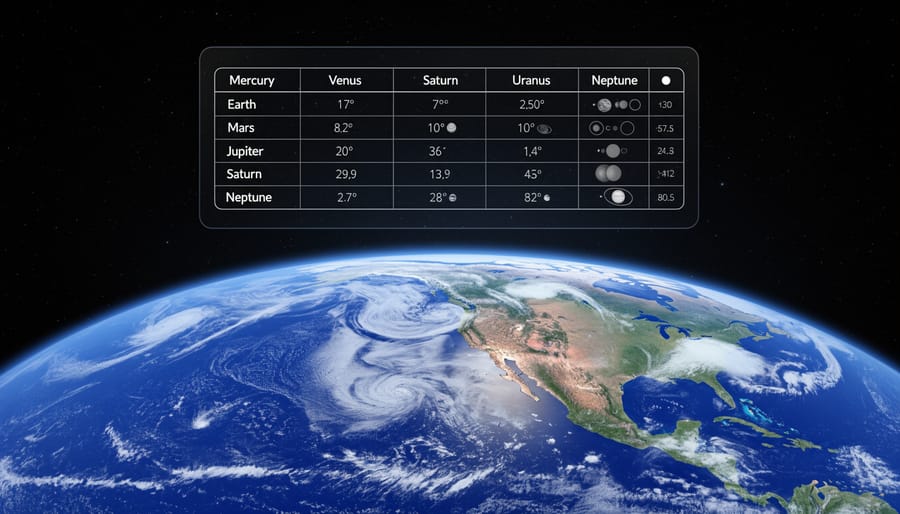
Reference tables make exploring space exciting because they let you compare planets side-by-side! Want to know how much bigger Jupiter is than Earth? Check the planet size column. Curious about which planet has the longest day? The tables show that Venus takes 243 Earth days just to spin around once!
These tables organize fascinating details in neat rows and columns. You can discover that Mercury zooms around the Sun in just 88 days, while Neptune takes a whopping 165 Earth years! The distance measurements help you understand why it’s so much colder on planets far from the Sun.
Moon counts are especially fun to explore. Saturn doesn’t just have a few moons, it has over 80! Jupiter has more than 90. You can also find information about dwarf planets like Pluto, asteroids, and comets.
Some tables even include facts about how planets formed, connecting to features like the transform boundary volcano activity on rocky planets. When you use these tables, you’re looking at the same information real astronomers use to study our solar system!
Rock and Mineral Information
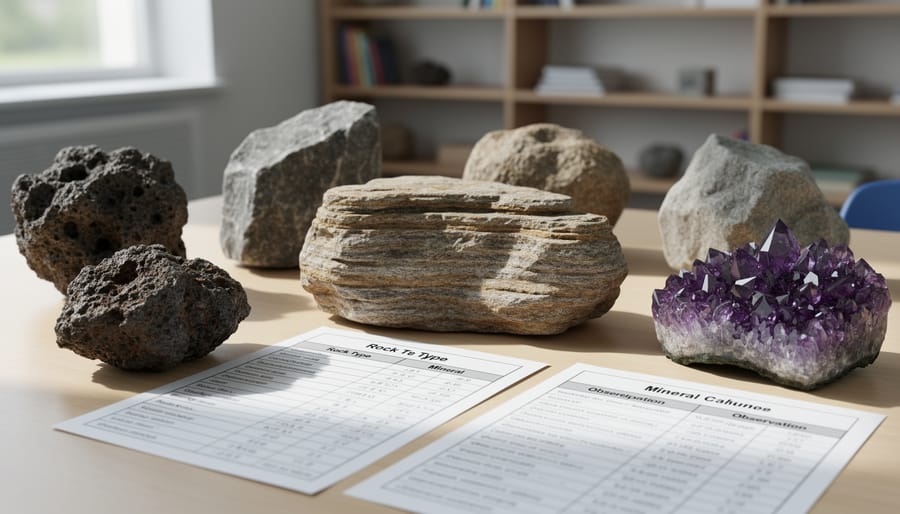
Reference tables are like detective tools for rocks and minerals. They show you important clues such as color, how shiny or dull something looks, and how hard it is (can you scratch it with your fingernail, or does it scratch glass?). The tables also explain how each rock formed, some cooled from melted lava, others got squished under heavy pressure deep underground, and some even contain volcano fossils from ancient eruptions.
When you find an interesting stone in your backyard or on a nature walk, you can use the reference table to figure out what it is. Maybe that sparkly rock is quartz, or that smooth gray pebble is limestone. The table helps you match what you see and feel to the correct name. It’s like solving a puzzle, where each clue brings you closer to identifying your discovery. Soon you’ll recognize different rocks just by looking at them, and you might start your own collection of special finds from around your neighborhood.
Weather and Climate Data
Reference tables contain colorful charts that show different types of weather and climate information. You’ll find pictures of clouds (like fluffy cumulus clouds that look like cotton balls or flat stratus clouds that cover the sky like a blanket) with their names and what weather they usually bring. The tables also show symbols that meteorologists use on weather maps, such as arrows for wind direction and special marks for rain, snow, or sunshine.
Climate zone sections help you understand why Florida is hot and tropical while Alaska is cold and snowy. The tables divide Earth into regions based on temperature and rainfall patterns. When meteorologists want to predict tomorrow’s weather, they check these reference tables to see what certain cloud formations or air pressure changes usually mean. It’s like having a weather detective’s guidebook.
You can use these tables to compare your local weather with other places around the world. Why does it rain so much in rainforests? Why are deserts so dry? The climate data in reference tables helps answer these questions by showing patterns that happen year after year in different parts of our planet.
Earth’s Layers and Structure
Ever wondered what’s inside our planet? Reference tables are like X-ray vision for Earth, they show you all the hidden layers beneath your feet! Just like cutting open a layered birthday cake reveals chocolate, vanilla, and frosting, reference tables reveal Earth’s secret layers.
The tables show Earth has three main layers. The crust is the thin outer shell where we live, like the crispy skin of an apple. Below that is the mantlea super-thick layer of hot, slowly moving rock (imagine gooey caramel). Finally, the core sits at the center, made of metal that’s incredibly hot.
What makes reference tables so helpful? They tell you exactly how thick each layer is! The crust is only about 5-70 kilometers thick (thinner under oceans, thicker under mountains). The mantle stretches about 2,900 kilometers deep. The core measures roughly 3,485 kilometers across, that’s almost as wide as the United States!
These tables also show what each layer is made of and how hot it gets. This information helps scientists understand earthquakes, volcanoes, and physical geography features on our planet’s surface. Pretty cool that a simple chart can reveal what’s happening thousands of kilometers below ground!
How to Use Reference Tables Like a Young Scientist
Using reference tables is easier than you might think! Once you learn the basic steps, you’ll feel like a real scientist discovering information on your own. Let’s walk through how to find exactly what you need.
First, think of a reference table like a well-organized bookshelf where everything has its special spot. Instead of searching through pages and pages of text, you can zoom straight to the answer. Here’s how to become a reference table expert:
- Figure out what you want to know. Ask yourself a clear question like “How far is Mars from the Sun?” or “What color is quartz?”
- Find the right table or chart. Look at the titles at the top of each table. A table labeled “Planets in Our Solar System” will have different information than one called “Common Minerals.”
- Look at the column or row headers. These are the labels running across the top or down the side. They tell you what type of information each column or row contains.
- Follow the lines to find your answer. Use your finger to trace from the row to the column where they meet, like following streets on a map until they cross.
- Double-check the units. Make sure you know if the measurement is in kilometers or miles, degrees Celsius or Fahrenheit, or grams versus kilograms. Units matter!
Now let’s talk about those mysterious symbols and abbreviations you’ll see. Don’t worry, they’re just shortcuts. “km” means kilometers, “°C” stands for degrees Celsius, and “AU” (astronomical unit) measures distances in space. Most tables include a key or legend that explains what each symbol means, just like a map legend shows you what different colors represent.
Here’s a helpful tip: if you get confused, start by reading any instructions or notes printed near the table. Scientists who created these tables want you to understand them, so they often include hints about how to read the information correctly. With a little practice, you’ll be looking up facts as quickly as checking your favorite app!
Fun Ways to Practice Using Reference Tables
Ready to turn reference tables into an exciting adventure? Here are some games that make practicing with these scientific tools super fun!
Planet Scavenger Hunt
Grab your reference table and see how fast you can find answers to these challenges. Can you list all the planets smaller than Earth? Which planet has the longest day? Find three planets that have more moons than Earth. Time yourself and try to beat your record each time you play.
Rock Hardness Challenge
Use the mineral hardness section to create your own “What Can Scratch What?” game. Pick two minerals and predict which one would scratch the other. Check the hardness numbers to see if you guessed correctly. You can even test real rocks at home with safe objects like pennies or your fingernail to see hardness in action.
Weather Detective Game
Look at the cloud type charts and spend a week identifying clouds you see outside. Keep a cloud diary with drawings and notes about which reference table pictures match the clouds above your house. Can you predict what weather might come next based on the cloud types you spot?
Planet Comparison Race
Challenge a friend or family member. One person calls out a planet name, and both players race to find three facts about it faster than the other person. Switch who picks the planets each round. You can also play “bigger or smaller” by comparing planet sizes, distances from the Sun, or number of moons.
Create Your Own Quiz
Make up five tricky questions using information from the tables, then quiz your friends, siblings, or parents. The person who creates the hardest questions wins!
Why Reference Tables Make Learning Easier
Having all your science information organized in one place is like keeping your toys in labeled bins instead of scattered around the room, you can find exactly what you need without wasting time searching! Reference tables work the same way. Instead of flipping through dozens of textbook pages or asking someone else for help, you can simply look up the answer in seconds. This makes homework and school projects much less frustrating because the facts you need are right there waiting for you.
These handy tools also help you become a better researcher and problem-solver. When you learn how to find information on your own, you feel more confident and proud of your work. You don’t have to wait for a grown-up to give you the answer because you already know where to look. Plus, reference tables make it super easy to compare things. Want to see which planet is biggest or which rock is hardest? Just scan the table and compare the numbers or descriptions. This helps your brain spot patterns and understand how different things in nature relate to each other.
The best part is that using reference tables builds independence. You’re learning skills that scientists, engineers, and explorers use every single day. When you can track down facts yourself, you become the expert. You’re not just memorizing information someone told you, you’re discovering it, which makes learning stick in your mind much better and feel a lot more exciting.
Common Questions About Earth and Space Science Reference Tables
Where can I find Earth and Space Science Reference Tables?
You can find these tables in science textbooks, printed as separate booklets from educational publishers, or online through school websites and educational platforms. Many schools provide students with their own copies to keep and use throughout the year.
Are reference tables the same everywhere?
Most tables contain the same basic scientific information since facts about planets, rocks, and Earth’s structure don’t change. However, different regions might use slightly different versions that emphasize local geology or include information about regional seismic activity and weather patterns.
Do I need to memorize everything in these tables?
No! Reference tables are meant to be tools you look things up in, not memorize. The goal is learning how to find and use information quickly when you need it, just like using a dictionary or calculator.
Can I use reference tables during tests?
This depends on your teacher or school, but many science tests actually allow students to use reference tables because the focus is on understanding concepts and solving problems, not memorizing facts. Always check with your teacher beforehand.
These tables aren’t just another textbook chapter to read through. Think of them as your personal science assistant that’s always ready to help. While textbooks explain concepts with stories and detailed lessons, reference tables give you quick facts without extra explanation. It’s like the difference between reading a whole book about pizza and looking at a recipe card that lists exactly how hot the oven should be.
Some students worry about all the symbols and abbreviations, but once you learn a few basics (like km for kilometers or °C for degrees Celsius), the rest become easier to recognize. If you spot an unfamiliar symbol, check the table’s key or legend, which usually appears at the bottom or in the introduction, explaining what each abbreviation means.
Now you have a powerful learning tool in your hands! Earth and Space Science Reference Tables might look like simple charts and lists, but they’re actually your secret weapon for understanding our amazing planet and the vast universe beyond. The coolest part? Real scientists, the ones discovering new planets, predicting earthquakes, and studying stars, use these exact same types of tables every single day in their work.
Think of reference tables as your personal science assistant that never gets tired of answering questions. Whether you’re curious about why Mars looks red, want to know which mineral is the hardest, or need to figure out what type of cloud you see in the sky, your reference table has the answer waiting for you.
The best way to get comfortable with these tables is to use them often. Start with topics that excite you most. Love space? Look up facts about different planets. Enjoy collecting rocks? Use the mineral table to identify your treasures. The more you practice, the faster you’ll become at finding information, and soon you’ll feel like a real scientist conducting research.
Ready to test your new skills? Try our interactive Earth and space activities to practice using reference tables while having fun. Happy exploring, young scientist!